It’s been only one month since the release of 0.60, but Social Network Visualizer version 0.70 is here! This summertime release justifies its existence with two new features, a built-in web crawler and multiple node selection.
The web crawler, based on some older tutorial code I had, is pretty simple software (don’t expect Google power here!), which automatically creates mathematical graphs starting with a given URL, called the seed. As the algorithm crawls that seed webpage, it identifies all the links inside the page and adds them to a list of URLs (called frontier). Then, all the URLs from the frontier are recursively visited. In this process, a network of pages (nodes) and links (edges) is being developed allowing the researcher to study and visualize network properties, such as centralities, etc.
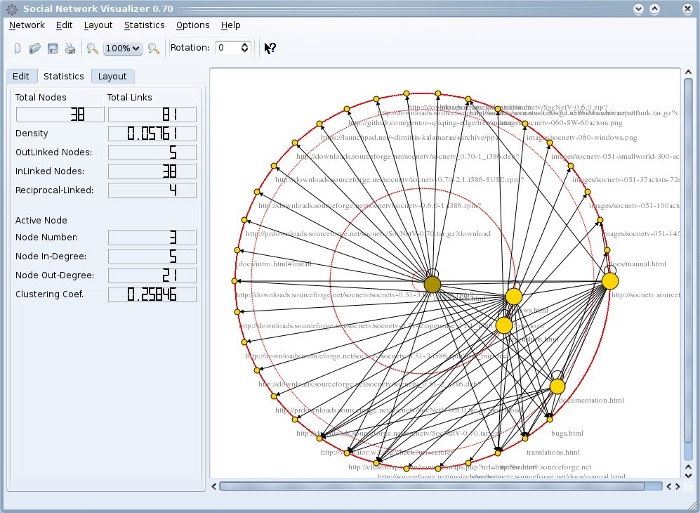
At the moment, the web crawler code is quite immature (i.e. doesn’t recognize framesets) but I hope it will evolve in the future. To test it, go to menu Network > Web Crawler (keyboard junkies, press Shift+C). A dialog will appear – enter the initial web address (seed), the maximum recursion level (how many URLs from the frontier will be visited) and the maximum running time and press OK. Here’s a screenshot of SocNetV crawling http://socnetv.org with betweenness centrality radial layout:
The other nice and new feature is multiple node selection. Nothing fancy here: press and hold left mouse button somewhere on the canvas, then move the cursor to select all nodes inside the rectangle selection area. At the moment, all you can do with your selected group of nodes is to move them, but in the future we’ ll provide something more useful. 🙂
SocNetV 0.70 also fixes a couple of bugs. For instance, #379204 which was crashing SocNetV when creating small worlds above 201 nodes and #381096 which was crashing SocNetV in Edge Filtering when an edge was reciprocal.
Furthemore, version 0.70 tries to speed things up, removing the on-the-fly Clustering Coef. and Average Distance and bringing some code improvements in random network creation routinesand FindNode method.
Last but not least, Tom Tryfonidis prepared Arch PKGBUILDs for SocNetV. So now, you can install it from AUR. Thanks Tom 😉
As usual, binary packages are ready for Ubuntu, openSUSE, Mandriva, and Debian – Fedora and Windows users will have to build from source at the moment…


provetza
Congratulations dimitris for the release, looking forward to try it! All the best
dimitris
thank you mate! 🙂
dimitris
dokimi metabasis sto neo server 🙂
salman jamali
Thanks man, I am using it, and it looks good 🙂
tsakf
Very nice tool! Congratulations! I don’t know if the results can be feeded to an econometric software like gretl, to get more info extracted for the data.
Keep on!
dimitris
Well, depending on what you need, the results might be either GraphML (XML) network data or plain text centrality reports. I don’t know if gretl supports them, but even if it doesn’t, XML is a flexible format; you could easily right a parser to transform the data to something that gretl can read…
Paul Ellison
You’ve opened a door I’ve been very interested in for a long while. Being not familiar with Linux the Windows exe is appreciated. Just a wee bit buggy but WONDERFUL work. Going to keep up with this and any other future projects you come up with as I’m sure they’re going to be worth it.
Appreciated!
Paul in Oklahoma