A new SocNetV release hit the road today. Version 1.7 solves a number of bugs and brings lots of interesting and useful new features to our users. Binaries for Windows, Mac and Linux are already available in the project’s Downloads page. Here’s what’s new…
Category: Science Page 2 of 5
The Social Network Visualizer project has just released its latest version 1.6. This new version brings back the web crawler feature, which has been disabled in the 1.x series so far, but in a much more improved form.
To start the web crawler, go to menu Network > Web Crawler or press Shift+C…
When I started developing SocNetV back in 2005 the term “social network” had a simple sociological meaning; any group of somehow “connected” actors, which might interest a sociologist to study and analyse in terms of their social properties and patterns (centralities, triads, etc). The actors can be of any type (humans, animals, organisations, companies etc) and so the cause of them being connected: working in the same place, belong to the same hive/group, mentioning each other, having commercial relations etc. Thus the main reason behind developing SocNetV was to create a simple “point and click” application that would enable the researcher to load his real-life gathered data and visualize/analyze the network properties. Or, in case the network was small enough, perhaps recreate it with some clicks on a canvas before analysing it. Back then it had never occurred to me that the same “social network” would be used now-days to describe online communities of million of users. As a matter of fact, I always thought that this strand of sociology is more meaningful in analysing relatively small groups rather than thousands of interconnected actors. Nevertheless, the term is used now this way too and this means that Social Network Analysis software such as SocNetV face a new problem: people not knowing anything about Social Network Analysis as a hybrid sociology-mathematics discipline think that all the software does is to “automatically” analyse any given online virtual community; who is connected to whom and how. Which is certainly not true.
This is the abstract of a paper published in the International Journal of Performance Analysis in Sport (Vol.15, No.1). In the paper we analyzed the network characteristics of successful and unsuccessful national teams that participated in FIFA World Cup 2014.
Over the last weeks, the Social Networks Visualizer (SocNetV) project has released two new versions which brought useful new features and of course a lot of bugfixes. The latest v1.4 closed even 4 years old bugs!
socnetv-v1.4-erdos-random-social-network
The strongest new feature of SocNetV is multirelational editing. You can now load or create a social network on the canvas, for instance depicting the friendship ties between kids in a classroom, and then add a new relation (Cltr+Shift+N) which it might depict i.e. “likes” between pairs of the same clasroom kids. And you can be do this very easily as we will demonstrate in this article.
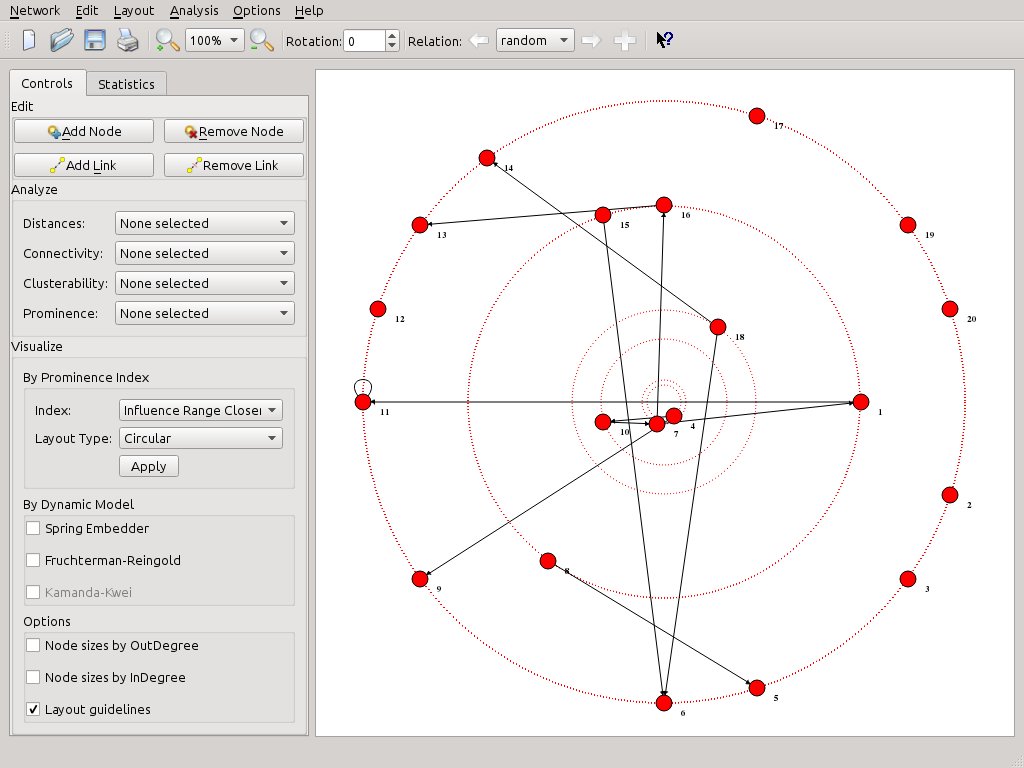
A new version of SocNetV, the cross-platform tool for social network analysis and visualization, has been released. Version 1.2 brings a major GUI overhaul, a new conceptualization of “prominence” measures, new importance and reachability measures, many new visualization layouts based on the new indices, and fixes a slew of bugs (see below).
Here’s a series of 31 images taken with a Dino-Lite digital microscope. I won’t go in details about the original source of the images, since most of them are pretty obvious (i guess).
Some of them are of poor quality, due to trembling hand or low resolution of Kamoso (KDE’s picture retriever). Anyway, have fun…