Over the last weeks, the Social Networks Visualizer (SocNetV) project has released two new versions which brought useful new features and of course a lot of bugfixes. The latest v1.4 closed even 4 years old bugs!
The strongest new feature of SocNetV is multirelational editing. You can now load or create a social network on the canvas, for instance depicting the friendship ties between kids in a classroom, and then add a new relation (Cltr+Shift+N) which it might depict i.e. “likes” between pairs of the same clasroom kids. And you can be do this very easily as we will demonstrate in this article.
Let’s say you create the social network of 20 kids. You can press Ctrl+A to add node and Ctrl+L to add link, or double click on the canvas to add a node and middle click on a node to start a new link from it. Or you can just import the network from GraphML, Pajek, Adjacency Matrix, UCINET (fullmatrix and edgelist1 formats) or a simple list file.
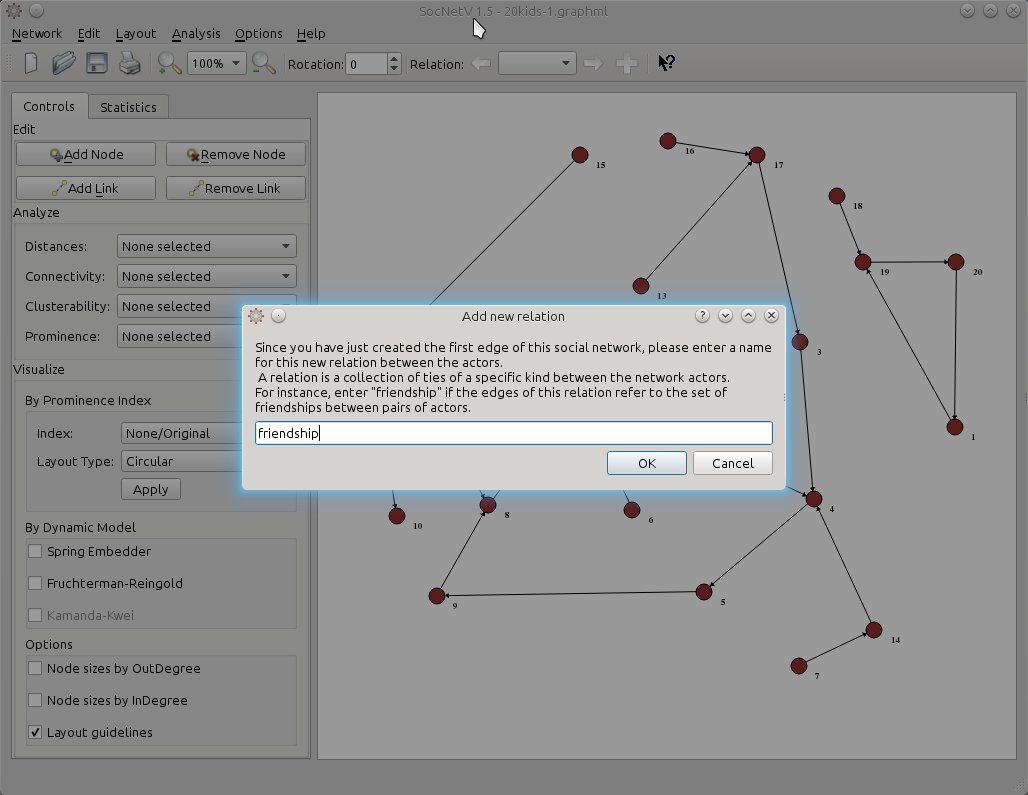
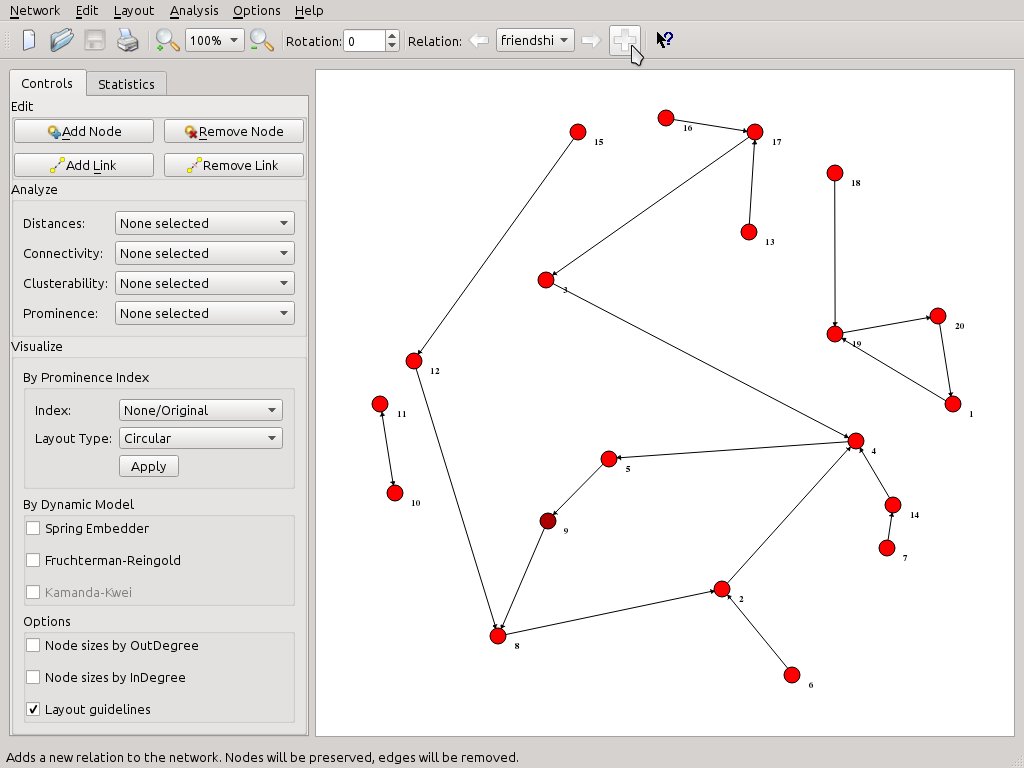
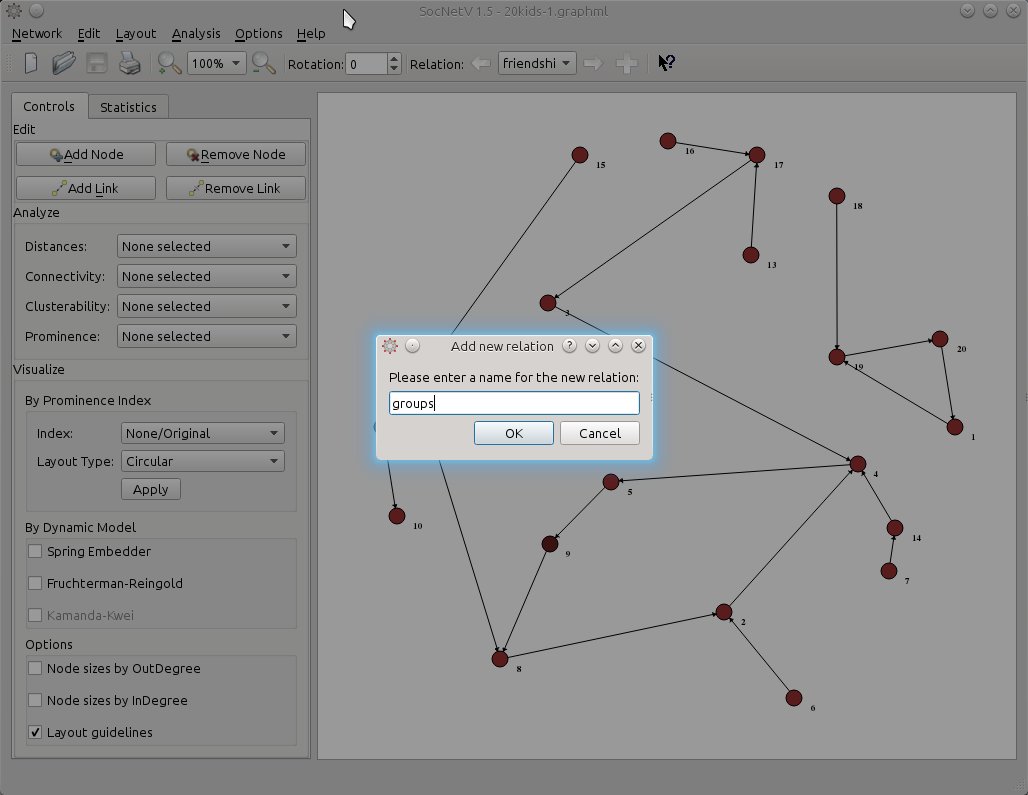
Since the edges depict ties of friendship let’s name this (yet unnamed) relation accordingly. Either press Ctrl+Shift+N or just the + button on the far right side of the toolbar and SocNetV will pop up a nice dialog informing what this is all about and prompting you to enter a first relation name. Note: The same dialog pops up when you add the first link in a new network.
Now, the toolbar Relation widget says we are editing on the friendship relation. Whenever we want to, we can press again on the + button to add a second relation.
Let’s say this new relationship is about groups or more specifically who the kids consider their group leaders. For simplicity, let’s name the new relation “groups”.
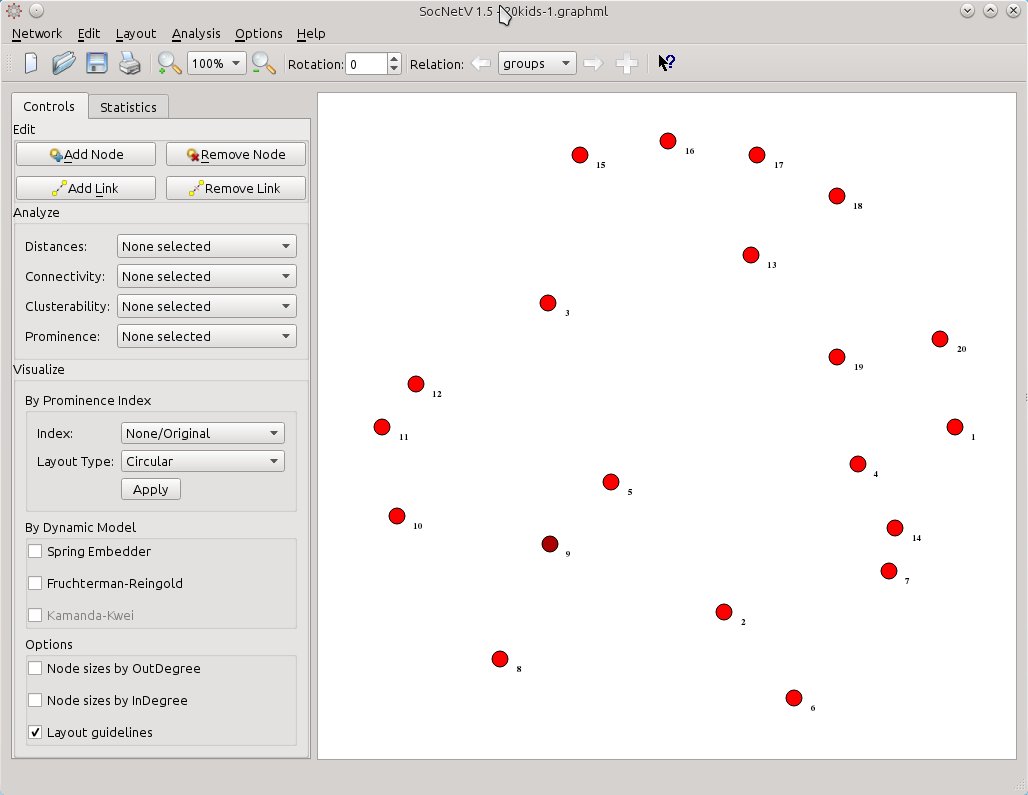
Now, when we press OK, SocNetV will change to a new relation called “groups”. This means it will remove from the canvas the edges belonging to the “friendship” relation and leave only the actors (kids). Thus, you are free to link them together with ties of the new relation:
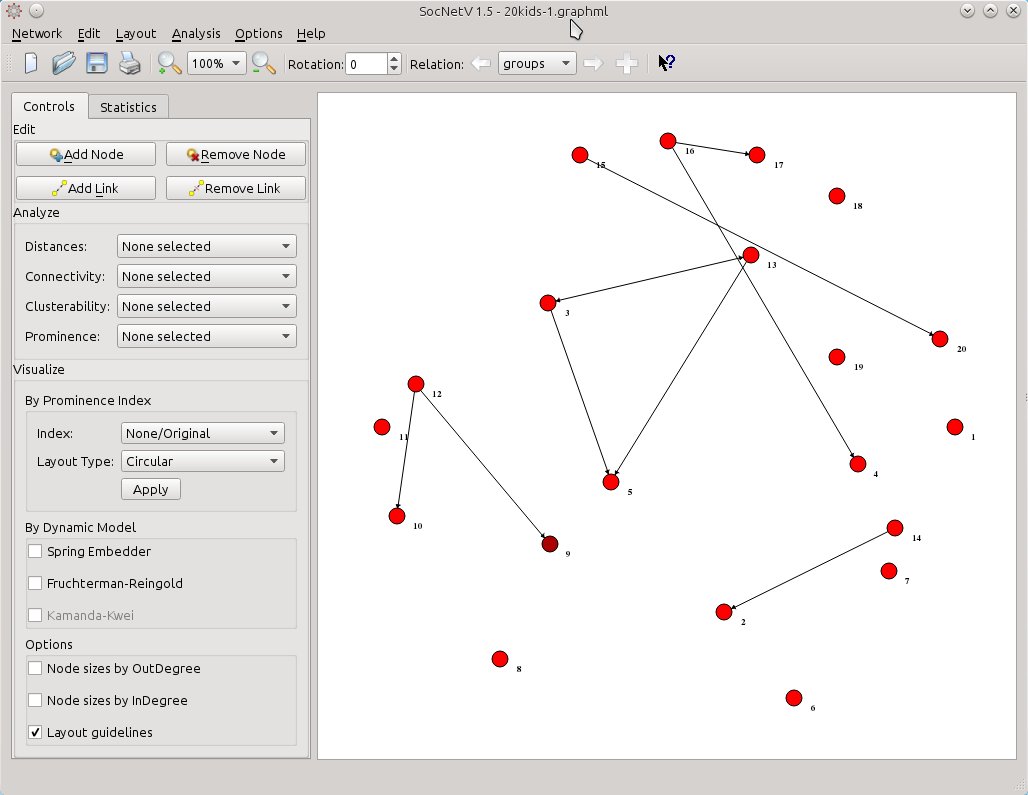
So, let’s create some “groups leader” links. As usual middle-click on a node to start a link and then middle-click again to another node to draw the new directed edge. You can even add new nodes if you like, but you cannot remove since that would alter the now hidden “friendship” relation as well. Maybe we’ll fix that too in a later release:
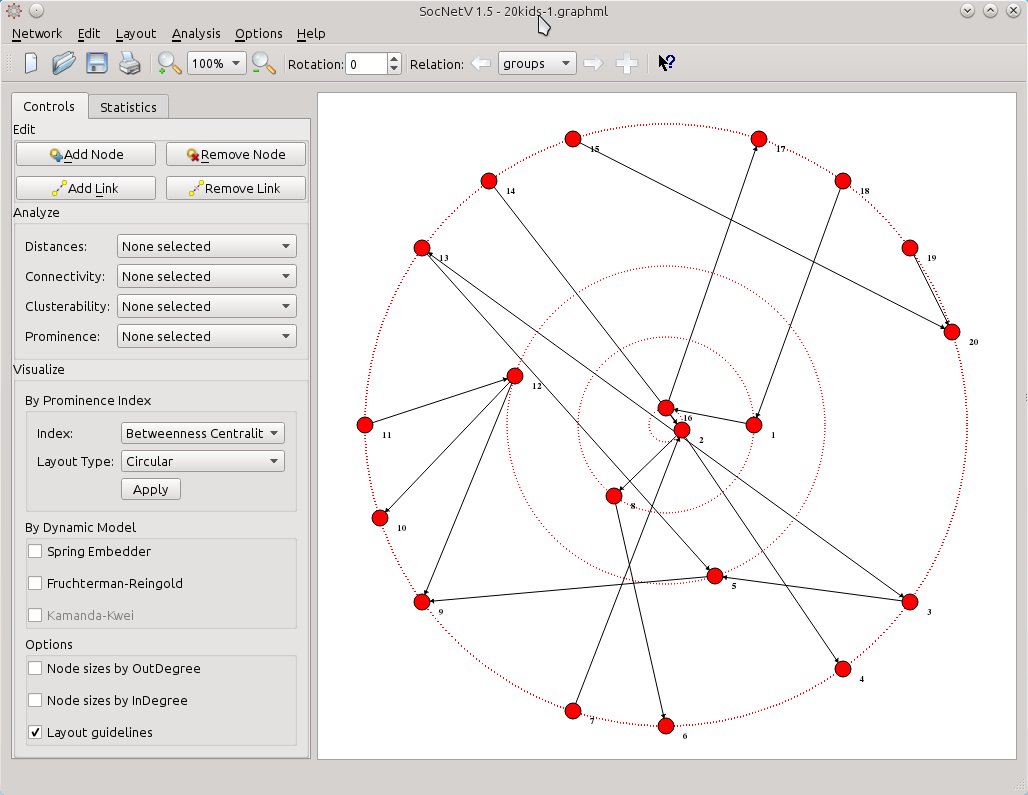
When you’re done editing, you can perform analysis and apply visualization layouts as usual – only in this case the actions will consider only the links of the active relation (groups). You can use shortcuts (Ctrl+1 to 8, Y,K, R to analyze and Ctrl+Shift+1 to 8 etc to circular layout) or select a layout from the handy toolbox in the left side of the window: Visualize > By Prominence Index. For instance select Index: Betweenness Centrality and Layout Type: Circular. Hit Apply et voila…
Now, you see who’s prominent and who’s not in terms of betweenness centrality scores. But this layout considers only the “groups” relation. Wouldn’t be nice to have a means to visually depict the centrality scores in the first relation and compare it at once with the same index scores in the second relation? That can be done, and easily too.
First, shift to the first relation, either by hitting the left arrow button in the toolbar or by pressing Ctrl+Left arrow key on the keyboard. SocNetV will hide the ties of the “groups” relation, load the “friendship” relation and draw its edges. But it will also keep the circular betweenness layout of the second relation we had already applied.
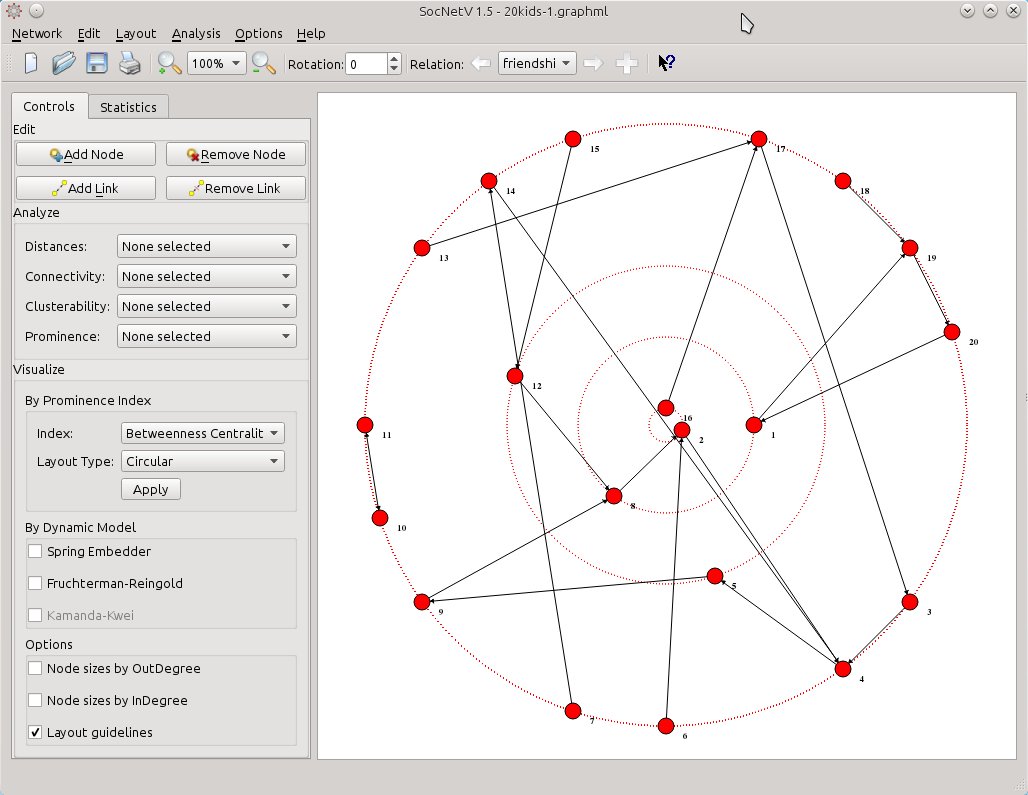
socnetv-v1.4-20-kids-classroom-social-network-friendship-first-relation-betweennes-circular-layout-of-the-second
Now, all you need is to select from Visualize > By Prominence Index the same index (Betweenness Centrality) but this time select Layout Type: Nodal size. SocNetV will calculate the Betweenness Centrality score of the actors in the current (friendship) relation and change their node size to reflect the score of each one. The larger a node is, the highest BC score has with regards to the “friendship” relation. At the same time, node positions will remain the same – they will still reflect the BC score of each actor with regards to the “groups” relation.
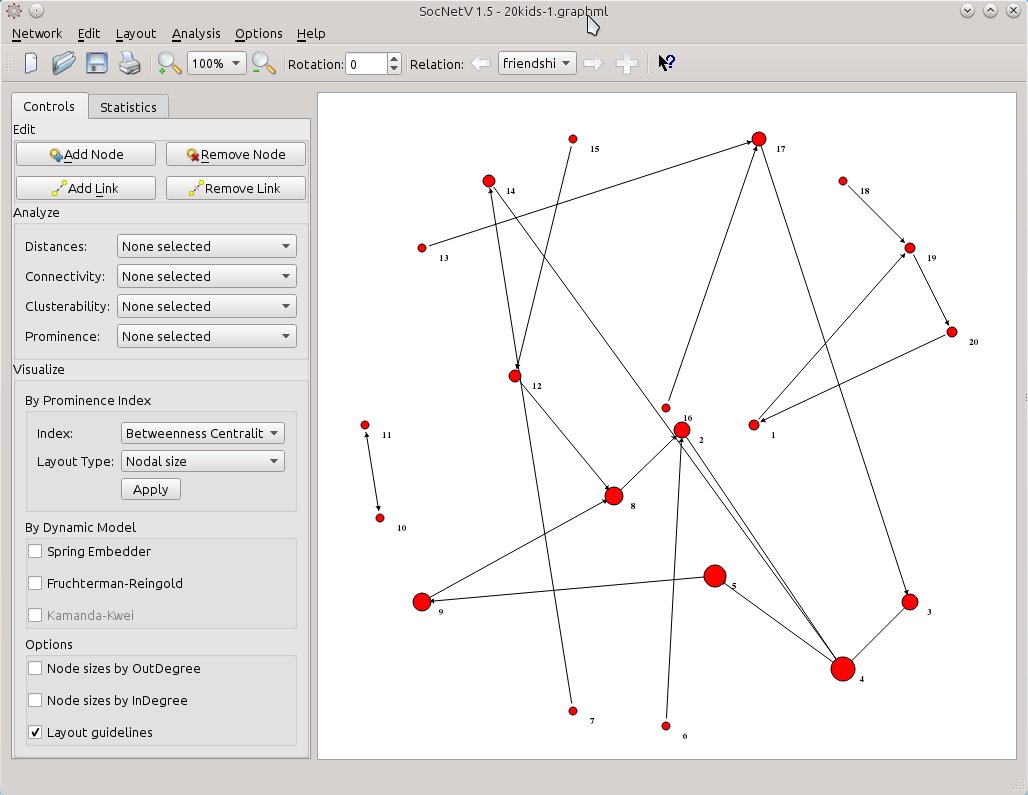
socnetv-v1.4-20-kids-classroom-social-network-friendship-first-relation-nodal-betweennes-circular-layout-of-the-second
So, now you have a mixed layout. Nodal size reflects “friendship” BC scores while positioning gives is a hint for “groups” BC scores. Thus, actor 4 is very prominent as a friend but not so prominent as a group leader.
Isn’t that nice or what?
Loading and saving multirelational social networks
Social Networks Visualizer v1.4 also supports loading multirelational networks (at the moment only from UCINET formatted files) and saving such networks as well.
But there’s a caveat in saving. SocNetV will not save all the relations of the network at once in the same file, rather it will only save the active relation. You will have to change to the other relations and then save them to separate files. This is a problem that will be also fixed in v1.5.
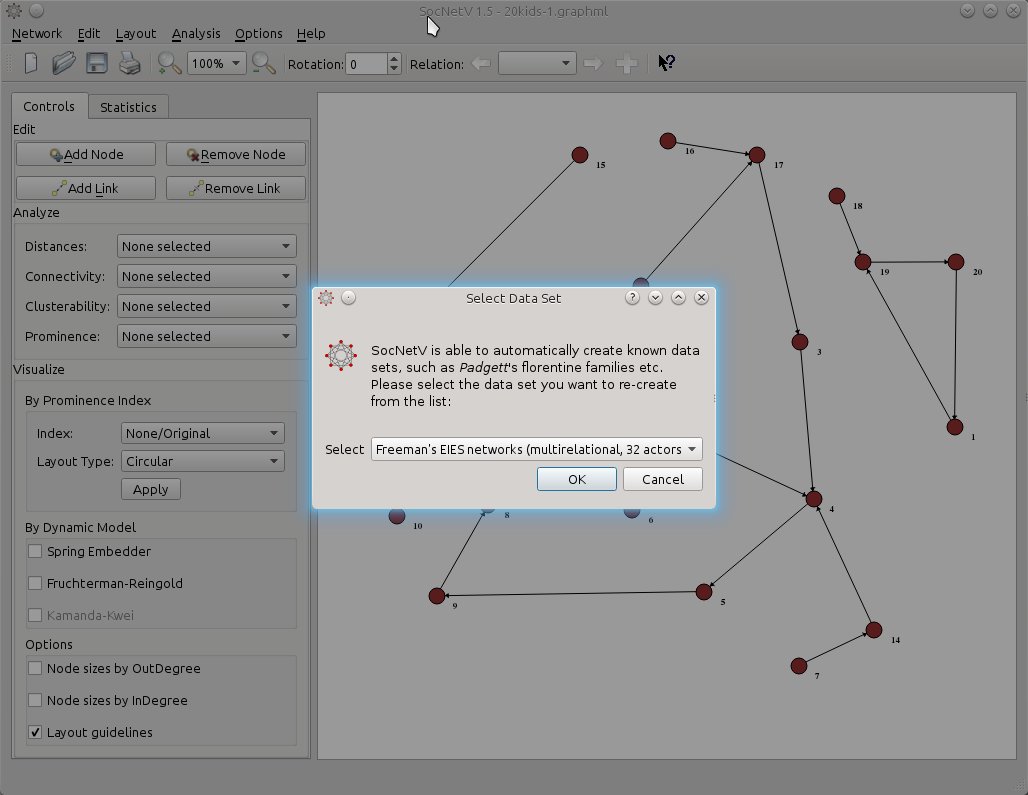
If you like, you can test multi-relation network loading with the new dataset: Freeman’s EIES networks. Just press F7 and select that dataset. SocNetV will even display a short message with info about the dataset (not displayed in this screenshot).
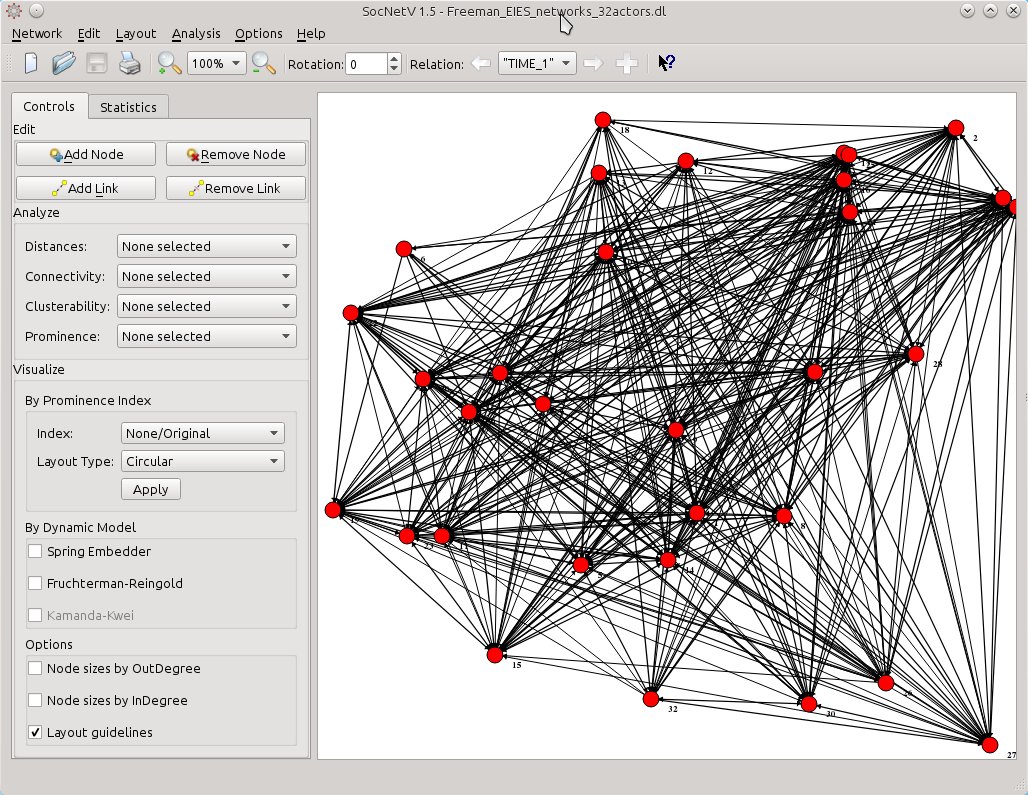
Then SocNetV will load the three-relations network of 32 actors at once and let you switch between relations and analyze them very easily… This is the status of the network at TIME 1
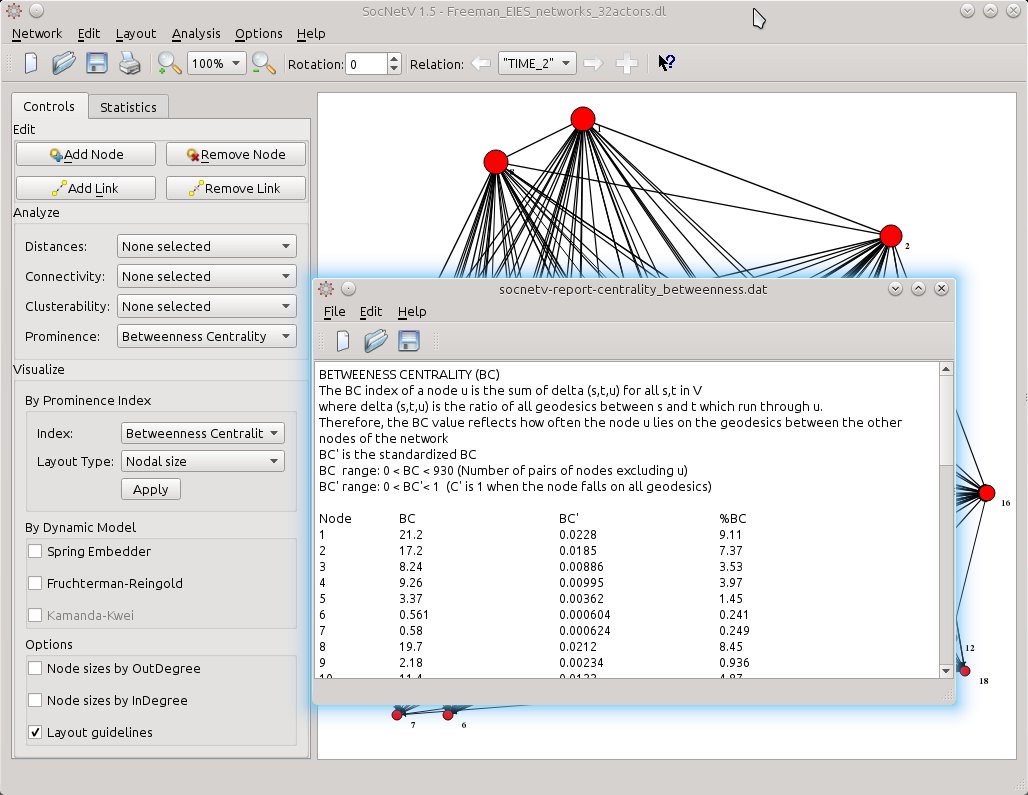
Shift to the next relation, “TIME 2”, and select the layout of your choice. In this example the actors are displayed in levels of BC scores (from top to bottom) while node sizes also reflect the same scores.
If you prefer hard data, just view the scores. From the left toolbox Analyze > Prominence, select Betweenness Centrality. The report will be displayed at once. One click only.
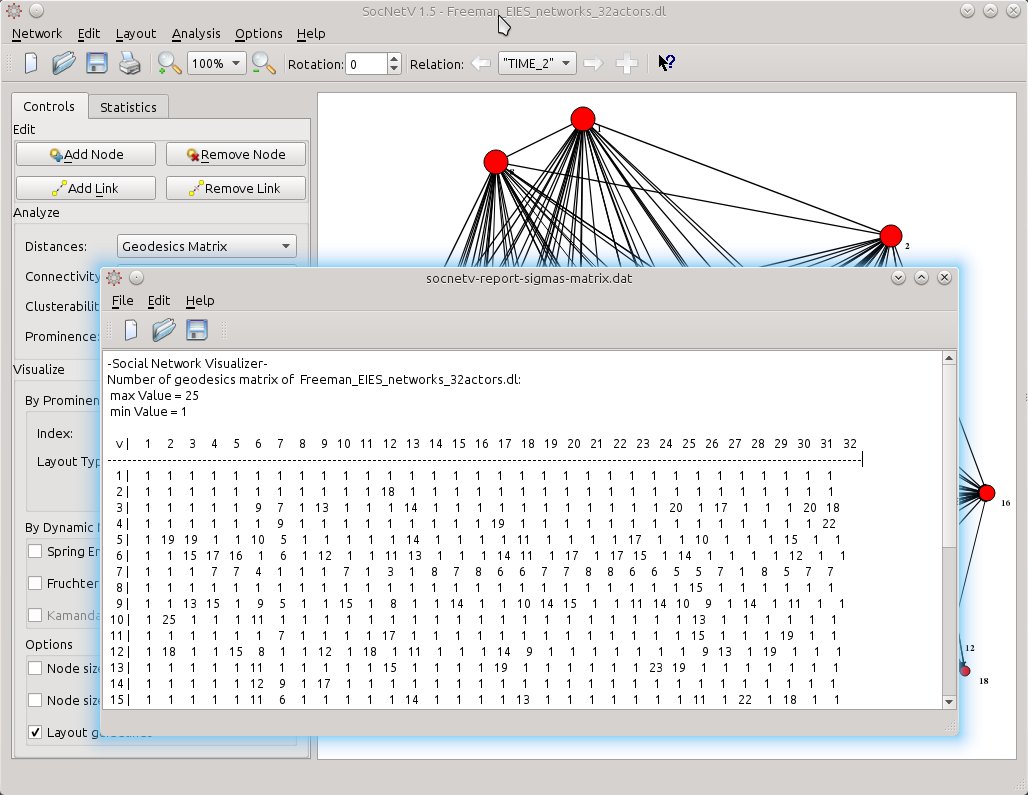
Or select Distances > Geodesics Matrix to calculate the number of geodesics (shortest paths) between pairs of actors.
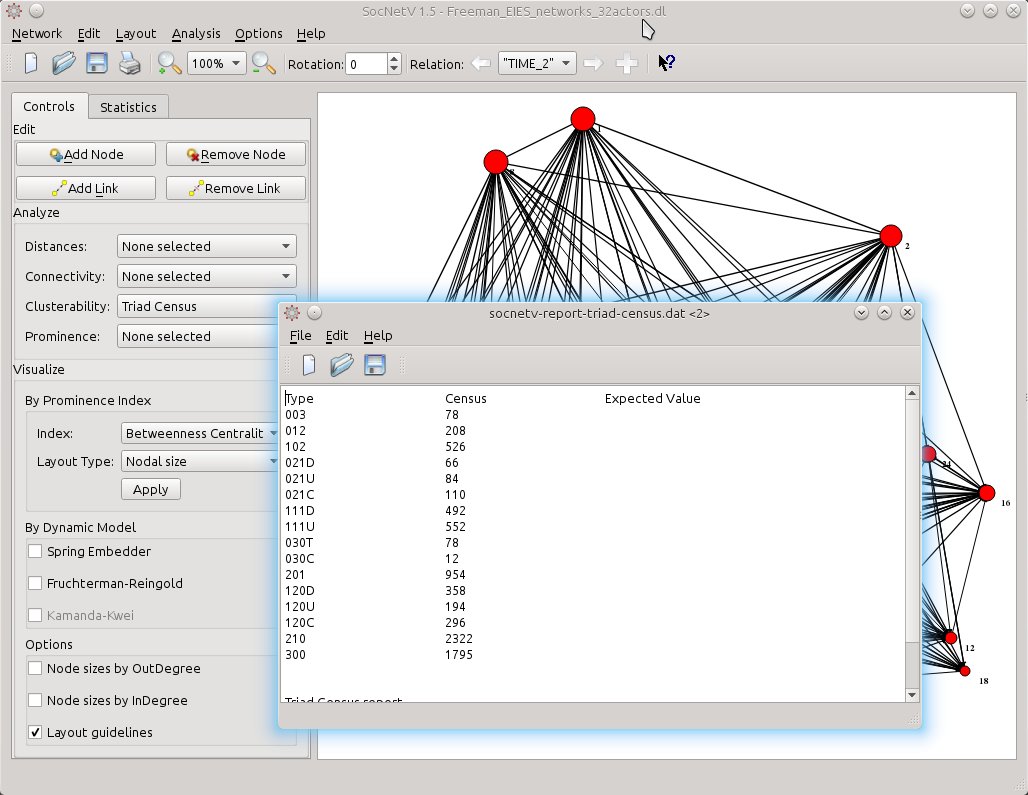
Or you might need a Triad Census. It’s as easy as it gets. From Analyze > Clusterability select Triad Census.
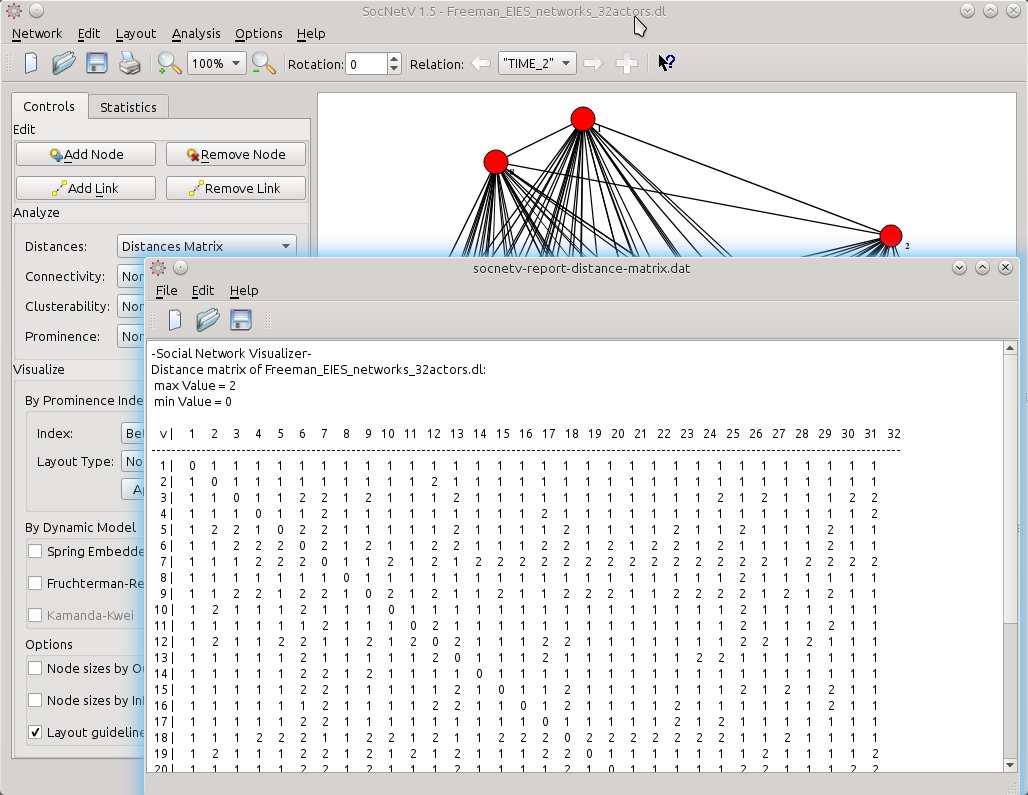
The same goes for displaying the distances (length of shortest path) between actors:
Memory optimizations
Apart from the aforementioned new features (multiple relations and nodal size layout), the latter versions of SocNetV and especially v1.4 are more optimized for low memory consumption and speed. In our tests on Intel i5 CPU and 4GB RAM, version 1.4 could easily load and display networks of 1000 actors and 10000 edges in a few seconds. And doing that it consumed under 400MB RAM.
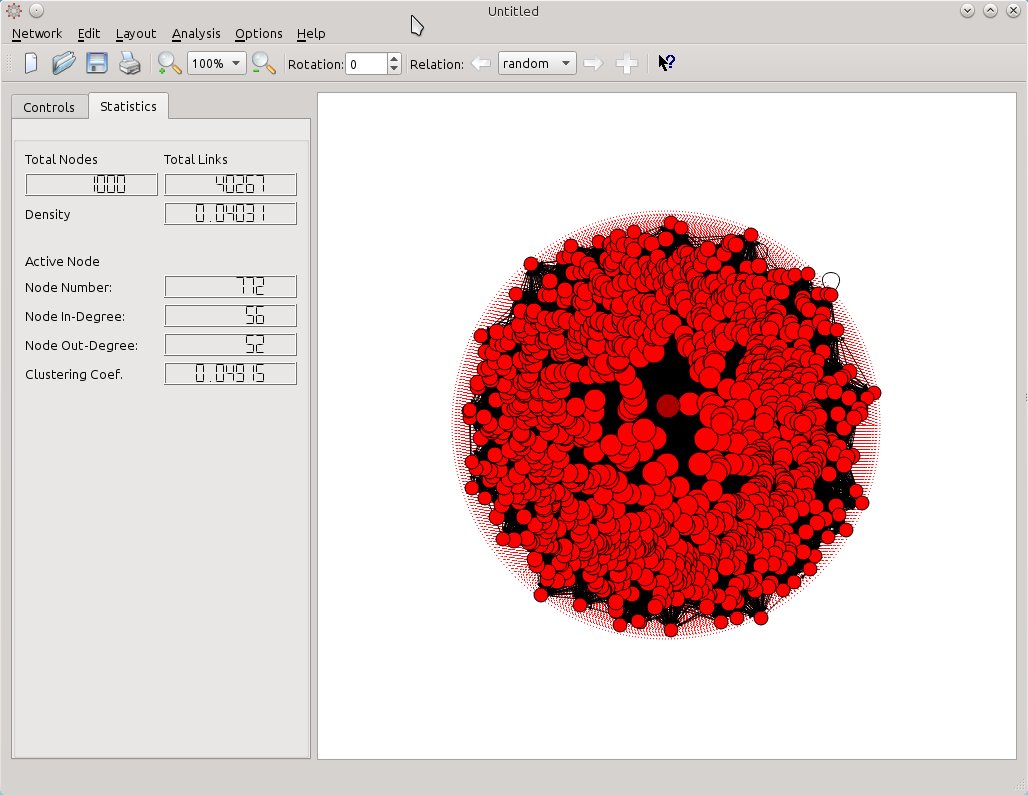
In the screenshot below, SocNetV v1.4 has created an Erdos-Renyi random network of 1000 actors connected with more than 40.000 edges. It was created in a QuadCore i5, 16GB RAM, in 1 minute.
The mixed circular-nodal layout reflects the BC score of each node. To the left, in the Statistics tab of the toolbox, network statistics such as Actors, Edges, and Density are displayed. Selecting a node, SocNetV displays its InDegree, OutDegree and clustering coefficient as well.
Versions 1.3 and 1.4 fixed a lot of bugs too (see ChangeLog). Nevertheless, do not consider SocNetV bugfree yet. Test it, play with it, but always verify you data. Or if in doubt just open a bug report so that we can help you out.





Leave a Reply