
A new version of SocNetV, the cross-platform tool for social network analysis and visualization, has been released. Version 1.2 brings a major GUI overhaul, a new conceptualization of “prominence” measures, new importance and reachability measures, many new visualization layouts based on the new indices, and fixes a slew of bugs (see below).
The new conceptualization and the different indices
In social network analysis, structural indices attempt to measure the visibility, the importance or the “prominence” of each node. In the past, SocNetV was generally referring to these indices as “centralities”. From now on, following Wasserman & Faust and Knoke & Burt, it distinguishes two types of prominence: Centrality and Prestige. Centrality indices were designed for undirected graphs (symmetric), where the relations are non-directional, thus the SocNetV user may compute Centrality scores for nodes in such social networks/graphs. Of course, Centrality indices can also be calculated to directed relations and digraphs but the algorithms always focus on “choices made” (or outLinks).
For digraphs, where the relations are directional, SocNetV introduces a range of Prestige indices which focus on “choices received” and measure the status, rank or popularity of each node among the other network actors. These indices measure the nominations or ties to each node from all others (or inLinks). Thus, Prestige indices can only be calculated on directed graphs, At the moment, there only 3 prestige indices available: Degree Prestige, Proximity Prestige and PageRank Prestige. More will be available in v1.3 to be released in late September.

Countries Trade dataset visualized per Degree Prominence index in a circular layout
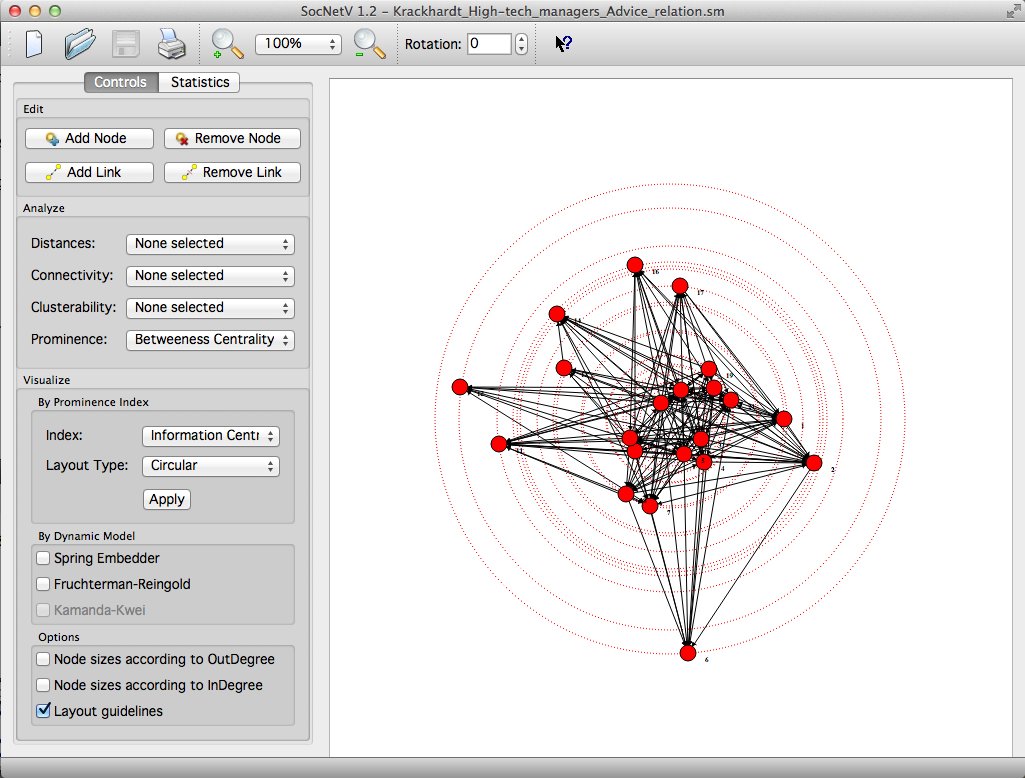
Krackhardt’s dataset of tech managers – circular layout based on Information Centrality (Mac OS X)
To sum up, Centrality indices can be applied on both graphs and digraphs (considering outLinks only) while Prestige indices can be calculated only on digraphs and they focus on inLinks.
According to the new conceptualization, the “Centralities” menu has been renamed to Centrality & Prestige. Here’s a list of Prominence indices available in SocNetV v1.2, along with the acronyms used in the application and its documentation:
- Degree Centrality (DC)
- Closeness Centrality (CC)
- Influence Range Closeness Centrality (IRCC)
- Betweeness Centrality (BC)
- Stress Centrality (SC)
- Eccentricity Centrality (EC)
- Power Centrality (PC)
- Information Centrality (IC)
- Degree Prestige (DP)
- Proximity Prestige (PP)
- Pagerank Prestige (PRP)
The revamped GUI/Toolbox
In order to make SocNetV more user friendly and easy to use, the left toolbox has now two tabs: Controls and Statistics.
The Controls tab offers all the essential features and actions grouped in “Edit” (add or remove node/link), “Analyse” (distances, connectivity, clusterability, prominence indices) and “Visualize” (by prominence index or dynamic models) boxes. You really need one click only (or keystroke Ctrl+3) to compute a complete Betweeness Centrality report for the active network. And one more click to apply a circular visualization layout based on the BC score of each node.
New features and measures
Except the Prestige indices, version 1.2 offers a new variant of Closeness Centrality, called Influence Range Closeness Centrality. For each node u, IRCC is the standardized inverse average distance between u and every other node reachable from it. This improved CC index is optimized for graphs and directed graphs which are not strongly connected.
Unlike the “ordinary” CC, which is the inverted sum of distances from node u to all others (thus undefined if a node is isolated or the digraph is not strongly connected), IRCC considers only distances from node u to nodes in its influence range J (nodes reachable from u). The IRCC formula used is the ratio of the fraction of nodes reachable by u (|J|/(n-1)) to the average distance of these nodes from u: sum( d(u,j) )/|J|.
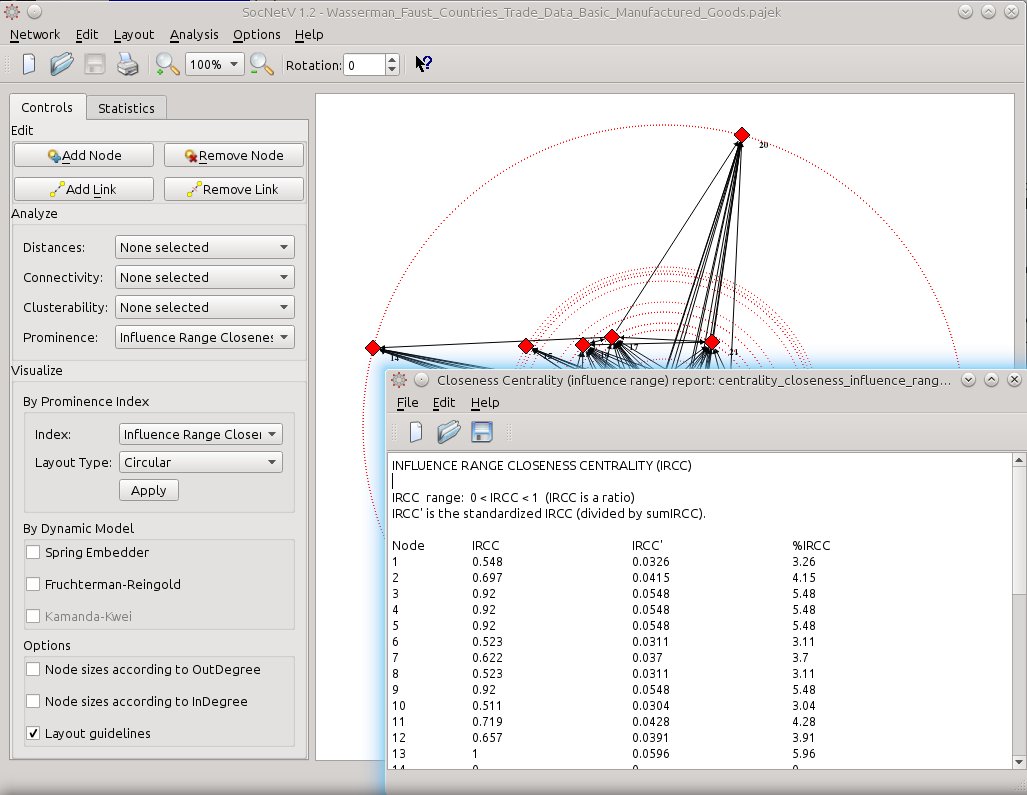
Influence Range Closeness Centrality scores for the actors in the Countries Trade dataset (in Linux).
The new version also incorporates new “reachability” statistics: Walks (of given length), Total Walks Matrix (for any path length up to g-1), and Reachability Matrix.
There is also a new “Connectedness” command, which checks whether the graph is connected, weakly connected (digraph) or disconnected, and a familiar “distance” index: Eccentricity e, the maximum farness of the node from all others.
New visualization layouts
SocNetV v1.2 offers a complete set of “circular” and “on levels” visualization layouts based on every available prominence index. Degree, Closeness, IR Closeness, Betweeness, Stress, Eccentricity, Power, Information Centrality as well as Degree, Proximity and Pagerank prestige.
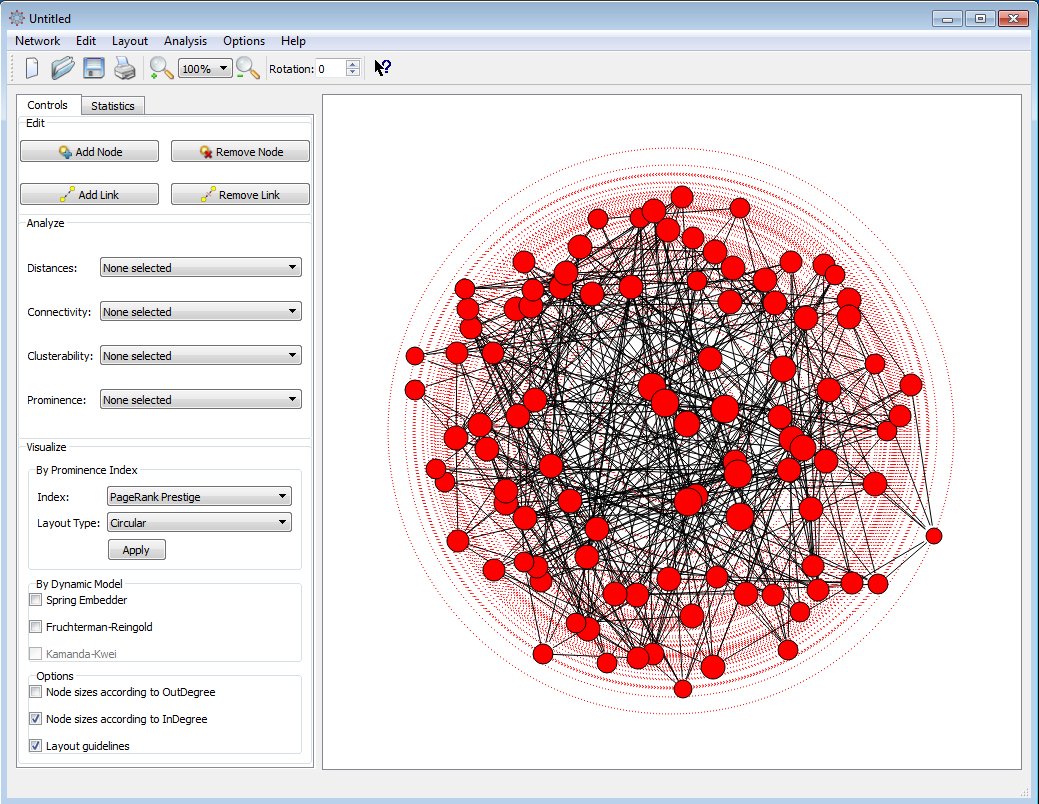
Random net of 99 actors: circular layout according to their PRP index (Windows build).
Fixed Bugs
Version 1.2 fixes the following bugs:
– Closeness Centrality calculation in disconnected graphs/digraphs (it did not drop isolates),
– Wrong classes for Power Centrality index
– Stress Centrality calculation in digraphs(wrong maxindex and out of screen circular layout in digraphs),
– Not displaying of edge weights,
– Eccentricity Centrality (wasn’t reported as the inverse e),
– Geodesic Distance (it reported two nodes as connected even if their distance was 0)
See ChangeLog for a complete list of features.
As usual, source code and binaries for Windows, Ubuntu, Fedora, openSUSE as well as a disk image for Max OS X 10.9 are available in the project’s Downloads.
Have fun!


Leave a Reply